

POWER BI pour SAGE 100 : De l’export Excel au pilotage dynamique
POWER BI pour SAGE 100 : De l’export Excel au pilotage dynamique
Walid Bergaoui
You know this month-end ritual: exporting the aged trial balance from Sage 100 to Excel, reworking CSV files by hand, rebuilding pivot tables, and fixing broken formulas — only for the number to be out of date by the time it's ready. This training puts an end to that waste. You'll learn to connect Power BI directly to Sage 100 and turn your ERP, which already runs your accounting and sales management, into a true decision-making instrument: reliable, automated, and viewable from your phone.
The approach is hands-on and built for the Tunisian SME. You start from what you already do — the Excel export — to understand its limits, then you scale up: connecting to Sage data, cleaning and transforming with Power Query, building a model that finally cross-references accounting and sales, and writing your first indicators in DAX (revenue, margin, year-over-year comparison in Year-to-Date and Month-to-Date). No more silos: you analyze your margin by product, by customer, or by sales rep without waiting for the period close. Then you design clear dashboards — forecast cash flow based on actual due dates, an overdue-payments map with visual alerts, working capital tracking — and you automate their refresh.
By the end of the program, you walk away with an operational dashboard connected to your own Sage 100 data, able to update itself and give you immediate visibility into daily revenue, upcoming collections, and the company's financial health. You'll no longer be at the mercy of your data: you'll steer it. This is the move from artisanal reporting to dynamic steering — the moment your numbers finally start working for you.
Not just concepts: deliverables ready to use in your company first thing Monday morning.
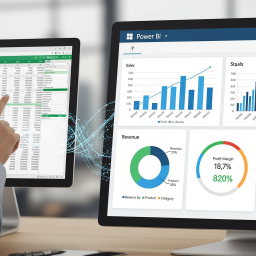
A dashboard connected to your data — connected to your Sage 100, with your real revenue, margins, and cash flow.
A reusable data model — Power Query queries and DAX measures you can duplicate and adapt at will.
Automatic refresh — your reports update on their own, shared and accessible on mobile.
Complete autonomy — the method to build your own business indicators, without depending on anyone.
A program that starts from your current Excel export and leads you, step by step, to a dynamic dashboard connected to Sage 100. Each session produces a concrete takeaway, all the way to reporting that refreshes on its own.
1. From spreadsheet to steering — why manual Excel export hits its limits; an overview of Power BI Desktop, the Service, and the "connect once, refresh always" logic.
2. Understanding your Sage 100 data — where accounting and sales management live, the key tables and fields, and best practices for a clean export from Sage.
3. Connecting to the source — linking Power BI to Sage 100 (structured export, ODBC, file folder) and choosing the right import mode for your setup.
4. Power Query, the end of reprocessing — clean, merge, and transform your files automatically; steps that replay with every refresh, with no broken formulas.
5. The star schema — organizing fact and dimension tables (customers, products, accounts) and creating the relationships that break down the accounting / sales silos.
6. The date table — the centerpiece of time-based analysis, essential for year-over-year comparisons, year-to-date totals, and due-date tracking.
7. Your first measures — the fundamentals of the DAX language; calculating revenue, gross margin, and margin by product, customer, or sales rep.
8. Comparing over time — automating year-over-year, Year-to-Date, and Month-to-Date to gauge performance at a glance.
9. Cash flow & overdue payments — building a forecast cash flow based on actual due dates, tracking working capital, and calculating overdue customer receivables.
10. Designing a dashboard that speaks — choosing the right visuals, prioritizing information, and setting visual alerts on overdue payments and critical thresholds.
11. Interactivity & free analysis — filters, slicers, and exploration: letting the manager cross-reference revenue, margin, and cash flow by customer, product, or period independently.
12. Publishing & refreshing automatically — distributing on the Power BI Service, scheduling the update, viewing on mobile, and sharing securely with your team.
POWER BI pour SAGE 100 : De l’export Excel au pilotage dynamique
POWER BI pour SAGE 100 : De l’export Excel au pilotage dynamique
No comments yet.
Log in to comment.