

POWER BI et NAVISION (Dynamics) : Le duo gagnant Microsoft
POWER BI et NAVISION (Dynamics) : Le duo gagnant Microsoft
Walid Bergaoui
Log in to comment.
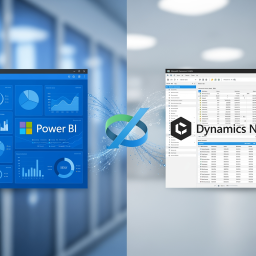
You use Microsoft Dynamics NAV (Navision) or Business Central, and every day your ERP records a gold mine: sales, purchases, inventory, receivables, production orders. Yet this wealth often remains locked away in austere, rigid RDLC reports that you cannot explore freely. This training gives you the power to unlock your data and steer your business with complete autonomy — because NAV and Power BI belong to the same Microsoft family, and their integration is quite simply the most natural on the market.
The approach is hands-on and business-oriented. You first learn to connect Power BI to Navision cleanly — via OData or through direct SQL access — then to transform and model your tables (customers, items, accounting entries, sales lines) to obtain a reliable, high-performance model. You then master the DAX language to create your own indicators: revenue, margin, DSO, stockout rate, production yield. No more waiting for a costly custom development to add a column to a report: you build interactive dashboards yourself where your sales, finance, and logistics directors find their answers in a single click.
By the end of the program, you walk away with operational dashboards plugged into your real data: a dynamic aged balance and DSO tracking, inventory management with stockout and overstock detection, production and material consumption monitoring, profitability analysis by item and by family. You will know how to publish, share, and refresh them automatically. It is the essential tool to modernize the way you run your SME — without changing ERP, and by giving autonomy back to your teams.
Far more than a theoretical course: ready-to-use deliverables and BSF's expertise on the Navision connector.
Your dashboards plugged into NAV — sales, finance, inventory, and production, connected via OData or SQL and refreshed automatically.
A library of reusable DAX measures — revenue, margin, DSO, aged balance, stockout rate, ready to adapt to your needs.
Autonomy for your teams — no more need for custom development to evolve a report.
BSF support — the best practices of a partner seasoned in Power BI & Dynamics integration.
A progressive, business-oriented program: we first connect Power BI to Navision, build a reliable data model, master DAX measures, then build the dashboards that truly drive your sales, finance, inventory, and production — all the way to publishing and sharing.
1. Microsoft's winning duo — why NAV/Business Central and Power BI integrate so naturally, the limits of RDLC reports, and mapping the data in your ERP.
2. Connecting via OData — exposing and publishing NAV/BC web service pages and queries, and consuming them in Power BI Desktop.
3. The direct SQL connection — accessing the NAV database tables, understanding the naming conventions (No., G/L Entry, Item Ledger) and choosing between OData and SQL.
4. Cleaning with Power Query — filtering, merging, and shaping your NAV tables (customers, items, entries) for clean, stable data.
5. Building the star schema — relationships between fact and dimension tables, a date table, and performance best practices.
6. Business hierarchies — item families, NAV analytical dimensions, geography, and sales organization to explore by levels.
7. The fundamental measures — revenue, quantities, margin, and cost; calculated columns vs. measures, and filter context explained simply.
8. Time Intelligence — running totals, year-over-year changes, moving averages: tracking your trends over time.
9. Sales management — pipeline and sales tracking, profitability by item and by product family, with full interactivity.
10. Receivables & cash — dynamic aged balance, DSO tracking, and analysis of customer outstandings to regain control of your cash.
11. Inventory & production — stockout and overstock detection, production order tracking, and material consumption.
12. Publishing & refreshing — publishing to the Power BI service, sharing with your teams, scheduling automatic refresh via the gateway, and securing access to the data.
POWER BI et NAVISION (Dynamics) : Le duo gagnant Microsoft
POWER BI et NAVISION (Dynamics) : Le duo gagnant MicrosoftLog in to comment.
Be the first to comment.