

POWER BI et Cegid : Consolider Retail et RH en un clic
POWER BI et Cegid : Consolider Retail et RH en un clic
Walid Bergaoui
Connectez-vous pour commenter.
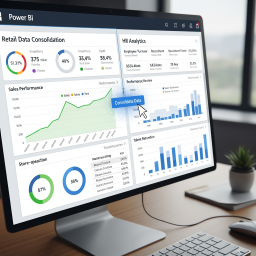
Votre Cegid contient déjà tout ce dont vous avez besoin pour décider — encore faut-il le faire parler. Que vous pilotiez un réseau de boutiques avec Cegid Retail (Y2) ou la finance et la paie avec Cegid XRP, l'information est là, juste dispersée entre les magasins, les exercices et les services. Cette formation vous apprend à brancher Power BI directement sur votre base Cegid et à transformer cette matière brute en tableaux de bord clairs, consolidés et actionnables — du chiffre d'affaires réseau jusqu'à la masse salariale, en un seul clic.
L'approche est concrète et orientée terrain tunisien. Vous commencez par les fondations : comprendre où vivent vos données dans Cegid (SQL Server), vous y connecter proprement, nettoyer et modéliser avec Power Query, puis poser les premiers indicateurs en DAX. Vous appliquez ensuite ces réflexes à vos deux univers. Côté Retail, vous bâtissez la vue consolidée multi-boutiques : CA au m², panier moyen, taux de transformation, stock réseau et réassorts, segmentation et fidélité client. Côté RH & Paie, vous transformez les données Cegid en outil de pilotage social : évolution de la masse salariale, écarts, heures supplémentaires et charges, absentéisme, turnover et bilan social.
À l'issue du parcours, vous repartez avec vos propres tableaux de bord Cegid, publiés et consultables sur votre smartphone en temps réel, où que vous soyez. Vous saurez actualiser vos données automatiquement, partager vos rapports en toute sécurité et faire évoluer vos modèles sans dépendre de personne. Vos données Cegid ne serviront plus seulement à éditer des tickets de caisse et des fiches de paie : elles deviendront le tableau de bord qui éclaire l'avenir de votre entreprise.
Cette formation ne s'arrête pas à la théorie : vous repartez avec des livrables prêts à l'emploi pour votre entreprise.
Vos tableaux de bord opérationnels — un cockpit Retail multi-boutiques et un cockpit RH & Paie, connectés à votre vraie base Cegid.
Le pilotage en mobilité — vos indicateurs sur smartphone, actualisés en temps réel, consultables partout.
Une bibliothèque de mesures DAX — les calculs clés Retail et RH réutilisables, prêts à adapter à vos besoins.
L'autonomie complète — connexion, actualisation automatique et partage sécurisé, pour ne plus jamais dépendre d'un rapport hebdomadaire.
Le parcours part des fondations Power BI et de la connexion à votre base Cegid, puis se spécialise sur vos deux univers — le Retail multi-boutiques et la RH & Paie — avant de tout publier, sécuriser et automatiser. Chaque séance s'appuie sur des données Cegid réelles.
1. Power BI & l'écosystème Cegid — Desktop, Service et application mobile ; où vivent vos données dans Cegid Retail (Y2) et Cegid XRP, et ce que la BI peut en tirer.
2. Se connecter à la base Cegid (SQL Server) — connecteur SQL Server, modes Import et DirectQuery, identification des tables clés ventes, stocks, tiers et paie.
3. Nettoyer & préparer avec Power Query — fusionner les sources, typer, dédoublonner et fiabiliser les données issues de Cegid avant analyse.
4. Modèle de données & premières mesures DAX — schéma en étoile, table de dates, relations, et les bases du DAX (mesures, agrégats, contexte de filtre).
5. Performance réseau — consolider tous les points de vente : CA, CA au m², panier moyen, taux de transformation et classement des magasins.
6. Pilotage des stocks réseau — visibilité globale du stock, rotation, ruptures et aide aux réassorts et transferts inter-boutiques.
7. Comportement & fidélité client — fréquence d'achat, segmentation dynamique et analyse de la fidélité à partir des données Cegid Retail.
8. Masse salariale & coûts — évolution de la masse salariale, analyse des écarts, impact des heures supplémentaires, primes et charges sociales.
9. Absentéisme & turnover — taux d'absentéisme, rotation du personnel, identification des départements et périodes à risque pour anticiper.
10. Bilan social & GPEC — du bilan social automatisé à la cartographie des compétences et au suivi des plans de formation.
11. Publication, mobile & partage sécurisé — publier sur Power BI Service, consulter sur smartphone, gérer accès et confidentialité des données sensibles (paie).
12. Actualisation automatique & maintenance — passerelle de données, rafraîchissement planifié et bonnes pratiques pour faire vivre vos tableaux de bord en autonomie.
POWER BI et Cegid : Consolider Retail et RH en un clic
POWER BI et Cegid : Consolider Retail et RH en un clicConnectez-vous pour commenter.
Soyez le premier à commenter.